Skip hours of research. Our experts have tested dozens of trading bots so you don’t have to. Answer 6 quick questions and get a personalized recommendation based on your trading style and goals.”
Best Log Management Tools for Trading Bots in 2026
The best log management tools for trading bots in 2026 depend on where your workers run, how much diagnostic data they produce and how long you need to investigate it. This comparison covers Amazon CloudWatch Logs, Google Cloud Logging, Grafana Cloud Logs, Better Stack Logs/Telemetry and Datadog Log Management. These services collect and search operational records; they do not execute trades or establish that an order filled.
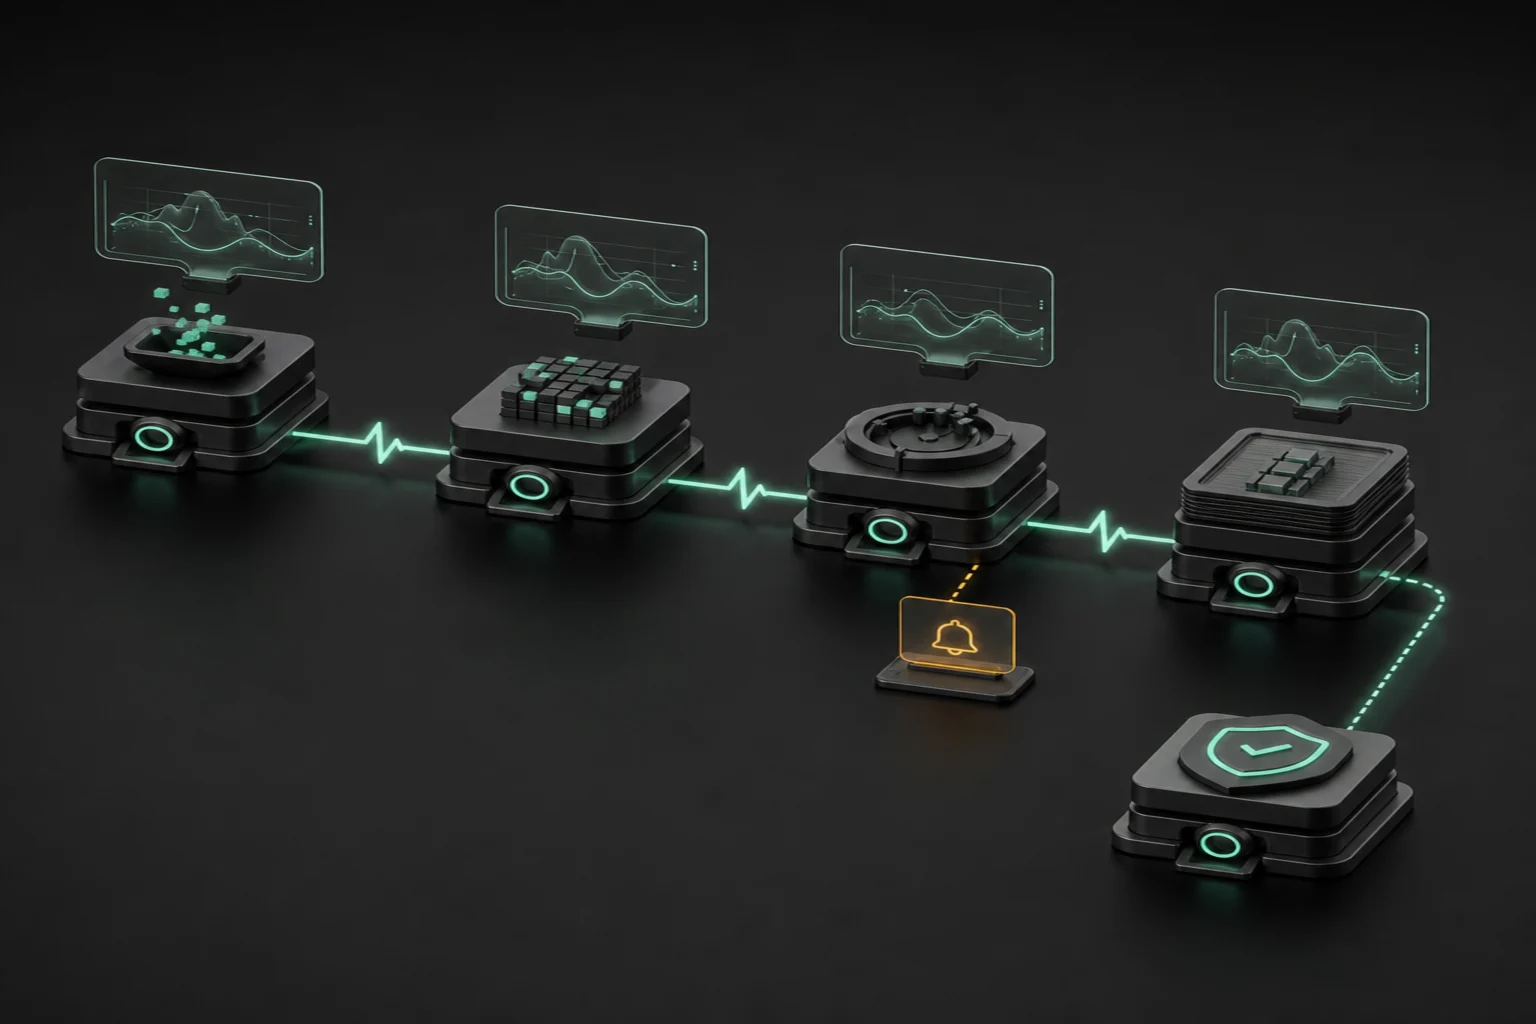
Start with an incident you actually need to investigate: an exchange rejected a request, a worker restarted between submission and acknowledgment, or a retry appears to have duplicated an action. Structured logging should connect those events using timestamps, worker identifiers, a strategy version and correlation IDs. Avoid recording credentials, authorization headers or unnecessary account details. A searchable pile of unstructured messages is not automatically useful evidence.
Define your minimum retention and investigation window before comparing headline prices. An inexpensive ingestion rate can exclude searchable indexing, query scans, archive storage or rehydration. A short free retention window may expire before a weekend incident is reviewed. Measure ordinary traffic and an error storm separately, then estimate costs for both. Decide which events must survive filtering, and assign someone to maintain collectors, access permissions and billing alerts.
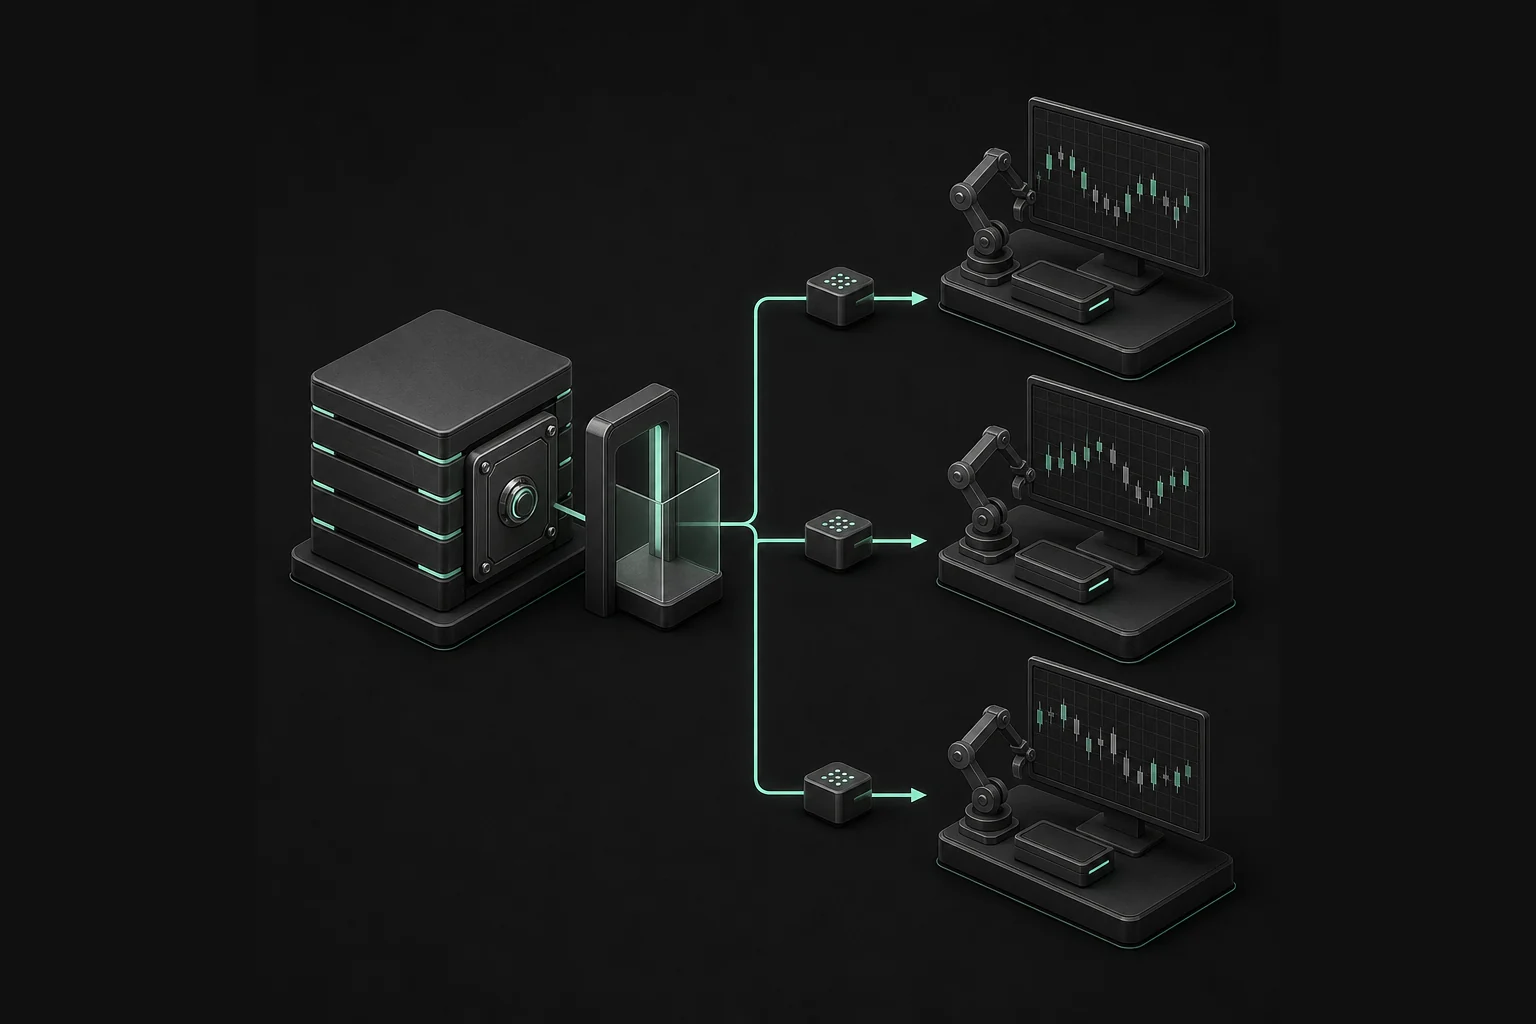
Centralized trading bot logs also introduce another dependency. Your worker needs an explicit policy for a slow collector, an unavailable destination or a full local buffer. Logging must not silently block the order path. Keep operational diagnostics separate from the broker records used to reconcile executions and balances. Our trading bot API guide explains the connection boundary. Use the comparison below to shortlist a logging service, validate its regional and account terms, and trial your own sanitized events in a paper environment before changing live infrastructure.
Quick Answer
1. Amazon CloudWatch Logs
Best for: AWS-native workers. It centralizes logs with query tools, retention policies and AWS access controls.
2. Google Cloud Logging
Best for: GCP-native bots. It provides log buckets, search and routing with location and retention choices.
3. Grafana Cloud Logs
Best for: Loki/Grafana teams. It offers managed Loki-based log aggregation within Grafana Cloud.
4. Better Stack Logs/Telemetry
Best for: teams combining diagnostics and incident workflows. It supports structured log collection, transformations and SQL querying.
5. Datadog Log Management
Best for: existing Datadog operations. It separates log ingestion from indexing and connects logs with other observability signals.
How we compare log management tools for trading bots
We reviewed the linked official sources on October 5, 2026. Criteria were structured events and correlation IDs, search, log retention, ingestion/indexing/query/rehydration costs, redaction, IAM/access, export/routing, regional availability, setup and maintenance, outage behavior and recovery, and support. The order reflects workflow fit, not a measured performance or reliability ranking.
This is documentation-based research, not hands-on performance, latency, contractual residency, eligibility, support or broker-compatibility testing. Official pages were accessible during verification, but that does not confirm your account's features or commercial terms. Better Stack's pricing page exposes multiple paid rate variants; we do not select an ambiguous rate. Prices below retain their stated units and billing qualifications rather than implying equivalent all-in bills.
Log management tools for trading bots: comparison table
Swipe horizontally, or focus this table and use Left/Right arrows. End reaches Pricing; Home returns to Tool.
Tool
Best For
Strength
Limit
Pricing
Amazon CloudWatch Logs
AWS workers
Native collection and queries
Class, region and scans affect costs
US East examples: $0.50/GB ingestion; $0.03/GB-month archive
Ingest from $0.10/GB; 15-day indexing $1.70/million annually billed
1. Amazon CloudWatch Logs
Best for: workers already running on AWS with someone responsible for IAM and operational billing.
Features: The official CloudWatch Logs overview describes centralized collection, Logs Insights queries, field indexes, retention controls and sensitive-data auditing/masking. Consistent event fields help connect an order attempt with its response and subsequent reconciliation. Native collection still requires configuration; a correlation ID must originate in your application.
Limits: Logs are retained indefinitely by default unless a retention policy is configured. Verify features for your log class and region, collector permissions, export requirements and recovery procedures. Platform masking does not justify transmitting credentials: redact before logs leave the worker. Narrow read access because operational records can reveal account activity even without keys.
Pricing: The official pricing examples for US East use $0.50 per GB ingested and $0.03 per GB-month of archived storage. These are examples, not a universal quote. Log class, volume, region, query scans, data protection and other services can change the bill. Model storage using the applicable billing basis rather than assuming raw ingestion and archived volume are identical.
Choose if: AWS integration avoids another operational platform. Avoid it if nobody can own retention and query budgets, or if required features are unavailable in the selected class or region.
2. Google Cloud Logging
Best for: GCP-native applications needing searchable log buckets and deliberate routing.
Features: The Cloud Logging documentation covers reading and writing entries, querying logs and controlling their routing. Buckets and access settings let teams organize records by operational need. Use structured fields for environment, worker and request identifiers so bot debugging does not depend on searching inconsistent free-text messages.
Limits: Verify bucket location, IAM, collector authentication and retention for your project. Routing a log to multiple buckets creates additional stored copies; exporting data moves it into another service's operational and billing model. A log entry accepted by Google is not proof that the exchange accepted or filled the associated order.
Pricing:Official Observability pricing lists ordinary log storage at $0.50 per GiB, with the first 50 GiB per project/month free and up to 30 days of storage included. Retention beyond 30 days is $0.01 per GiB/month. Special log categories have different treatment. Routing itself has no additional charge, but destination storage, duplicate copies and export services can add costs. Keep GiB distinct from decimal GB.
Choose if: GCP access and bucket administration already fit your team. Avoid it if unmanaged copies or an unverified residency requirement make the apparent free allowance misleading.
3. Grafana Cloud Logs
Best for: teams comfortable with Grafana and Loki-style investigation across multiple services.
Get the Top 5 Bots for Early Retirement report:
Features: Grafana's product and pricing page describes managed Loki-based log aggregation and Adaptive Logs. This can reduce the need to operate your own logging backend. You still need collectors, a consistent event schema and queries that answer practical incident questions. Keep highly variable request identifiers in appropriate structured fields rather than choosing labels without understanding their cardinality implications.
Limits: Confirm stack region, access controls, collector support and plan-specific capabilities. Automatically dropping apparently unused records can remove evidence needed after a rare incident. Approve filters against a required-event list and retain a tested export plan. A managed backend does not remove ownership of application instrumentation or incident response.
Pricing: Free access lists 50 GB/month and 14-day retention; Pro starts at $19/month plus usage. The billing documentation separates processed, written, retained and queried volume. Processing occurs before Adaptive Telemetry optimization, so dropped-after-ingestion data can still incur processing. Querying beyond the documented fair-use allowance adds another dimension. Confirm current allowances, retention increments and volume discounts instead of multiplying everything by one ingestion price.
Choose if: existing Grafana skills and cross-service investigation justify the model. Avoid it if you expect data filtering to erase every cost or cannot validate which events remain searchable.
4. Better Stack Logs/Telemetry
Best for: small teams wanting log investigation alongside an integrated incident workflow.
Features: The Telemetry documentation links collection through OpenTelemetry, Vector and HTTP, transformations, querying and alerts. The platform supports structured logs and SQL investigation. Check the actual source integration and event format your worker can emit; a generic collector option is not a ready-made integration with every trading platform.
Limits: Confirm data region, retention, permissions, query options and export behavior. Log access and responder/on-call capabilities have different commercial boundaries. Having both products in one interface does not establish a response-time commitment or guarantee that an alert reaches the right person. Test ownership and escalation separately.
Pricing: The current pricing page lists 3 GB of logs per month retained for three days on the free allowance. Paid ingestion, retention and query options differ, and the retrieved page exposes multiple rate variants. We do not quote an unresolved paid rate: confirm the selected billing terms and volume with the vendor. Budget responder/on-call charges separately from telemetry, and ensure three-day retention is sufficient for your review schedule.
Choose if: verified collectors and SQL fit your team and the incident workflow is useful. Avoid it if short free retention or unresolved paid terms prevent a defensible operating budget.
5. Datadog Log Management
Best for: teams already investigating infrastructure, metrics or traces in Datadog.
Features: The Log Management documentation describes collection, processing pipelines, indexing, archives and correlation with other signals. Separating ingestion from indexing supports different treatment of frequently searched incident records and less frequently accessed history. Your application must still propagate meaningful identifiers; correlation cannot reconstruct events you never recorded.
Limits: Check the selected Datadog site, access model, retention and feature availability. Archive storage, rehydration and Flex storage/compute are different paths, not interchangeable labels for unlimited searchable history. Confirm recovery time and cost for an investigation spanning older records. Other observability subscriptions and support terms require their own review.
Pricing:Official pricing starts ingestion at $0.10 per GB. The displayed 15-day Standard indexing rate is $1.70 per million log events with annual billing, or $2.55 on-demand. Ingestion alone is not the searchable-log bill: event count, retention, storage, compute, archive and rehydration choices matter. Rehydration can involve scanning compressed archived data and indexing matching events; estimate both rather than treating archive recovery as free.
Choose if: shared Datadog workflows outweigh introducing another service. Avoid it if nobody can model both byte volume and indexed-event count, or if required historical recovery has not been validated.
Choose log management tools for trading bots by workflow
Budget/small bots: Choose Google Cloud Logging for an existing GCP worker within its allowance. Avoid it when duplicated buckets or extended retention undermine that estimate.
Beginners: Choose Better Stack Logs/Telemetry if a verified collector and SQL workflow are understandable to your operator. Avoid it if you expect automatic broker reconciliation without instrumentation.
AWS/GCP-native: Choose Amazon CloudWatch Logs for AWS or Google Cloud Logging for GCP when existing identities simplify administration. Avoid either if its required region, permissions or features are unconfirmed.
Loki/Grafana teams: Choose Grafana Cloud Logs to reuse established investigation skills. Avoid it if the team cannot distinguish processed, written and queried volumes.
Integrated incident workflow: Choose Better Stack Logs/Telemetry when its logs and separately budgeted response tools fit. Avoid it if escalation ownership or responder licensing is unresolved.
Datadog stack: Choose Datadog Log Management when signal correlation supports existing operations. Avoid it when selective indexing and historical recovery costs are not understood.
Active/high-frequency workflows: Choose Amazon CloudWatch Logs for AWS workers only after validating asynchronous collection and bounded buffers. Avoid placing it, or any remote logging service, synchronously on the order-critical path.
Compliance/retention: Choose Google Cloud Logging only if documented location, access and retention controls meet your requirements. Avoid treating any vendor's retention setting as proof of legal compliance or immutable evidence.
Broker constraints: Choose Grafana Cloud Logs if your worker can legally export sanitized events in a supported format. Avoid it, or any option, when platform restrictions prevent reliable collection or export.
Keep diagnostics separate from execution truth
Application logs are not authoritative broker execution records. An ingestion acknowledgment confirms receipt by the logging service, not an order fill. Logging does not guarantee exactly-once execution: retries and duplicate events need application-level handling, and uncertain order status needs broker reconciliation. Record timestamps, request IDs and state transitions without implying that a local “submitted” message proves an executed trade.
Redact credentials before transmission, including nested exception details and request headers. Use the secrets-manager comparison for credential delivery, not permission to log secrets. Configure bounded buffering, retry limits and an explicit full-buffer policy. Surface dropped-event counts and collector failures through independent monitoring; do not let a logging outage silently block the order path or consume unlimited disk.
No. Application logs and ingestion acknowledgments are not authoritative broker execution records. Reconcile uncertain orders against broker status and executions.
Does logging guarantee exactly-once execution?
No. Duplicate requests, retries and uncertain responses need explicit application handling and broker reconciliation. A logging platform cannot establish exactly-once trading behavior.
Can I send API keys and mask them later?
No. Redact credentials before transmission, including headers and exception payloads. Destination masking is an additional control, not a substitute for removing secrets at the source.
What should happen when logging is unavailable?
Use bounded buffering, limited retries and an explicit overflow policy with independent failure alerts. Logging must not silently block the order path or exhaust local storage.
Educational software research, not financial advice, a performance claim or a security guarantee. Verify current official pricing, account terms and broker restrictions before changing live infrastructure.
Free Report
Before You Choose a Bot, Read This
Get our free Top 5 Bots for Early Retirement report plus The Bot Report newsletter — the bots we'd actually trust to compound over the long term.
Written by
TradingBotExperts Editorial Team
14 min read
The TradingBotExperts Editorial Team researches trading software, official documentation, operational tooling and trading automation risks.
How to Choose the Best Trading Bots for Your Strategy
Take our free quiz to show how to pick bots that actually work for you
Get My Free Bot Report
Get Our Expert Bot Recommendation
Skip hours of research. Our experts have tested dozens of trading bots so you don’t have to. Answer 6 quick questions and get a personalized recommendation based on your trading style and goals.”
Join The Bot Report newsletter and get our free guide to the five trading bots most likely to help you retire early — backed by real reviews and verified performance.